
In my previous blogs, I have outlined what a data lake is, how to get started and what capabilities are needed for a multi-tenancy platform.
In this publication I will detail an architectural pattern that addresses the key challenges that arise on building a large-scale Big Data and AI infrastructure. This pattern, if implemented, provides a capability that can be shared across large and small globally distributed companies.
The pattern is called "Synchronised View Architecture" and it combines modern data architecture techniques with on-demand cloud infrastructure and search and indexing approaches.
I have outlined previously a number of challenges which this pattern attempts to solve, but to recap I have summarised the key ones, below
Challenge | Impact |
Large complex schemas and data models |
|
| Running processes with different priorities, security and resource profiles |
|
| Coping with different data access patterns and data structures |
|
| Slioed, bad quality/unknown data |
|
| Building and running slow time-to-market and costly data platforms that deliver low ROI |
|
The fundamental nut that needs cracking is that different producers and consumers interact with the data in different ways.
Lots of technologies try to coerce workloads into a particular processing pattern and sometimes, even worse, a particular technology or, vendors will try to persuade you to glue together a number of disparate technologies in complex pipelines that copy data between them many times, costing time and money for no added business value
Synchronised View Architecture
The Synchronised View Architecture pattern takes a different approach, summarised by the following:
- Having all data assets stored, indexed and catalogued in a global self-contained repository so that they are easy to find by users of different technical ability and based in different geographies
- Only reformatting data when you need to, i.e. for each use-case, to avoid slow-to-produce, brittle and complex schemas that try to support multiple and sometimes divergent use-cases
- Processing using the users choice of technology, rather than forcing all users onto one tool
- Running processes on dedicated on-demand infrastructure. Running only when needed and under the relevant compliance and security resource profiles
- And, doing all this on an infrastructure that has components that are designed to work together in a "low friction" way, rather than a collection of frameworks that require sophisticated engineering capability to get working together
In this pattern, producers send data in a form that suits the business process that created it i.e. the same structure as its original purpose.
The data ingested is stored as a document of the all the data attributes that allows the object to be as self-contained as possible. I.e. it is stored in as a hierarchical structure (lists, maps etc.) with of all its dependencies, rather than having foreign key relationships to other elements.
This allows data attributes to be used across different businesses but avoids the ETL'ing into central data model
Consumers access the data that has been "reformatted" into a structure that suits them. For example, the view format could any one of a table, Star Schema, Document, graph etc. This allows different users to access the data in different ways without forcing them to use the same engine for everything
Data is accessed in a catalogue with a search engine interface. This significantly reduces the time taken to discover new data from weeks to seconds
It's materialised and persisted in-memory, where possible, and cached on disk, where not. The views are synchronised, i.e. that have meta-data that describes how the view was created so it can be recreated at any time, even at past incarnations, by using versioning. This stops fragmentation and proliferation of data and technologies i.e. the business went of and copied the data and built their own stack.
View engines can be spun up when needed and can comprise of different technologies that is appropriate for each use-case.
All engines, processes and management applications are spun up as containers so that they can:
- scale automatically, be run only when needed, to save cost
- be resilient, because their life-cycle is managed by the container cluster manager
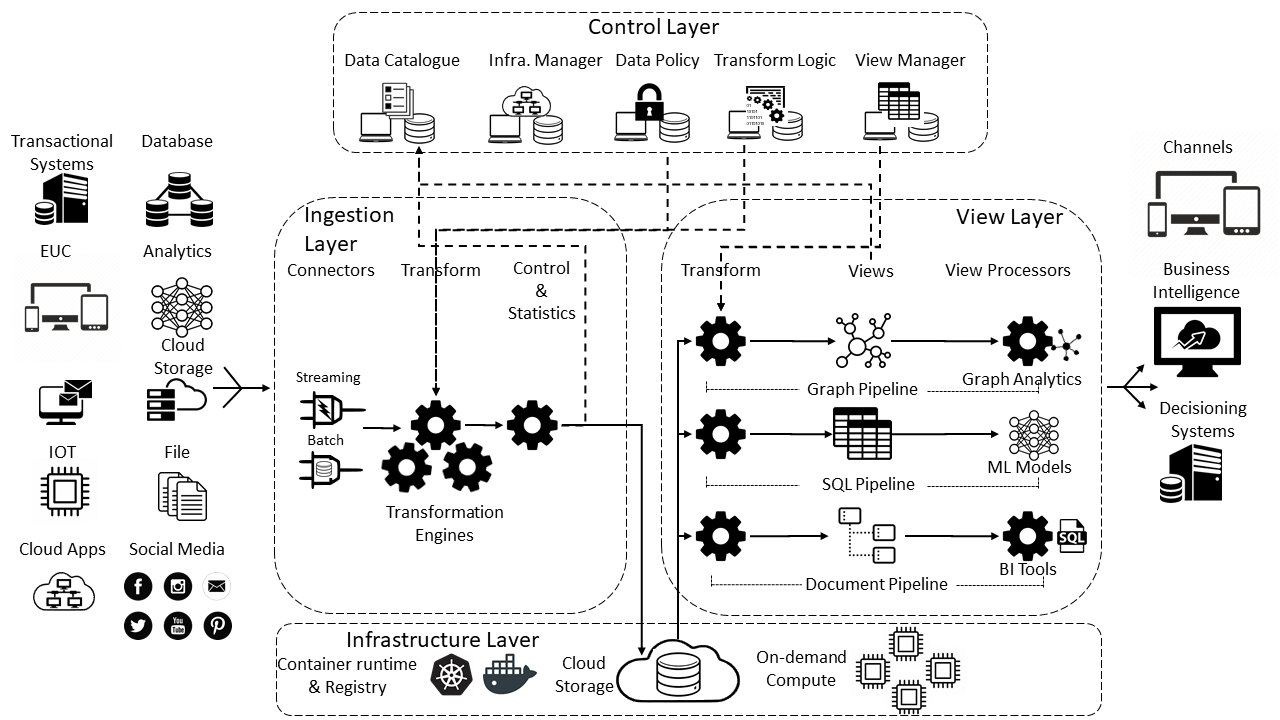
The architecture is split into the following four layers
- Ingestion Layer
Is the entry point for accepting changes to any of the data in the system - View Layer
Provides materialised "Views" of the data for each use-case. - Control Layer
Houses all the control and management functions that manage the infrastructure including all the meta-data and User interfaces. It also includes the global repository which houses all the data ingested into the infrastructure. - Infrastructure Layer
Utilises hybrid cloud storage, compute and containerisation to run all the functions on the infrastructure
Ingestion Layer
The purpose of this is to get data into the infrastructure as quickly and flexibly as possible without any major transformations
The reason for limiting the transformations is, because we don't know want the data is going to be used for (above the original use-case). I.e. we don't want transform it away from it's original just yet
It contains the following two components:
- Connectors
These, provides the entry points to receiving data.
Connectors are provided for batch and streaming patters plus many connection protocols and data formats. - Transformation and Augmentation Engines
These provide the heavy lifting to get the data into format that can be accessed by the views.
View Layer
This component is responsible for creating "Views" for each use-case. I.e. data sets based for individual business lines and specific business problems. All view data sets are created from the global repository.
This is the key component to allow sharing of data for different usages, access patterns and SLAs etc.
It contains the following components
- View Executors These are processing engines that are triggered by data objects being created in global repository by the ingestion process. The perform the following functions:
1. Spin up the view processors that serve the view users queries. They ask the infrastructure layer to for compute resources to run the processors.
2. Prepare data sets for use by the view processors. - View Data Sets
These a reformat of the data in the global catalogue in the form that each business use-case needs it in to process correctly
It is important to think that these are transient. This for resiliency, i.e. can be recreated easily from the source data and to provide an abstraction from the global repository data - View Processors
These are engines that provide the relevant type of data processing for the specific use-case. E.g. A SQL engine for BI queries, a graph engine for graph analytics, machine learning model frameworks (e.g. Python/Scikit learn) etc.
They run on separate specific on-demand cloud compute infrastructure and can to provide the right runtime environment for their use-case.E.g. auto-scaling, network isolation, low cost instances etc.
They also contain the connectors to import and push data to and from components external to the system
It's important that the view is "synchronised" to the rest of the system i.e. the schema and meta-data is known and controlled by the management layer to stop the fragmentation that occurs using disparate components.
Hence, "Synchronised View Architecture"
Control Layer
The control Layer houses all the management functions for the whole infrastructure.
It contains the following components
- Data Catalogue
This contains the schemas, meta-data and pointers to the location, in cloud storage, of all the data that has been ingested into the infrastructure - Infrastructure Manager
Controls the compute, storage, container registry and executors and other resources that run all aspects of the infrastructure - Data Policy
Contains description and logic for any policies that need to be applied to resources on the infrastructure, including: security, data quality, SLAs etc. - Transformation
Contains logic and meta-data for pipelines. When a pipeline is created, the execution graph, (including, steps, logic, schemas and configuration) and associated meta-data is stored here. This enables the system which view executor to run and passes these details to it to execute. - View Manager
Contains all the meta-data to create views. This includes registration to events that occur in the global repository as well as logic and meta-data that enables the right view executor to be started on the event creation.
Infrastructure Layer
This component utilises cloud providers and their respective management functions to provide all the network, compute, storage, orchestration, application container and run-times across an enterprise globally
It includes public cloud, private cloud (using on-premise Kubernetes installations) and edge footprints (using docker).
It has the concept of zones that can have polices associated with them to provide aspects like data sovereignty and locality
It contains the following components
- Container run-time and registry
The infrastructure leverages the cloud providers container services to execute docker images based on profile meta-data stored in the transform and view components.
The registry contains images of all supported run-times including dependencies. These include technologies like Spark, Jupyter, RStudio etc. - Cloud Storage
This component contains the storage infrastructure for the whole infrastructure. It wraps native blob, file and archive storage from the public and private cloud providers (private leveraging third-party blob stores like Ceph and distributed file systems like XtremeFS). - On Demand Compute
This component utilises the cloud provider on-demand compute capability (native compute for public cloud and Kubernetes POD execution for private cloud) as well as docker for running on edge devices. - This layer also runs all the control layer applications, including WebApps, API end-point services and meta-data storage databases.
To explain what each component does, let's look at some example use-cases to frame the problem.
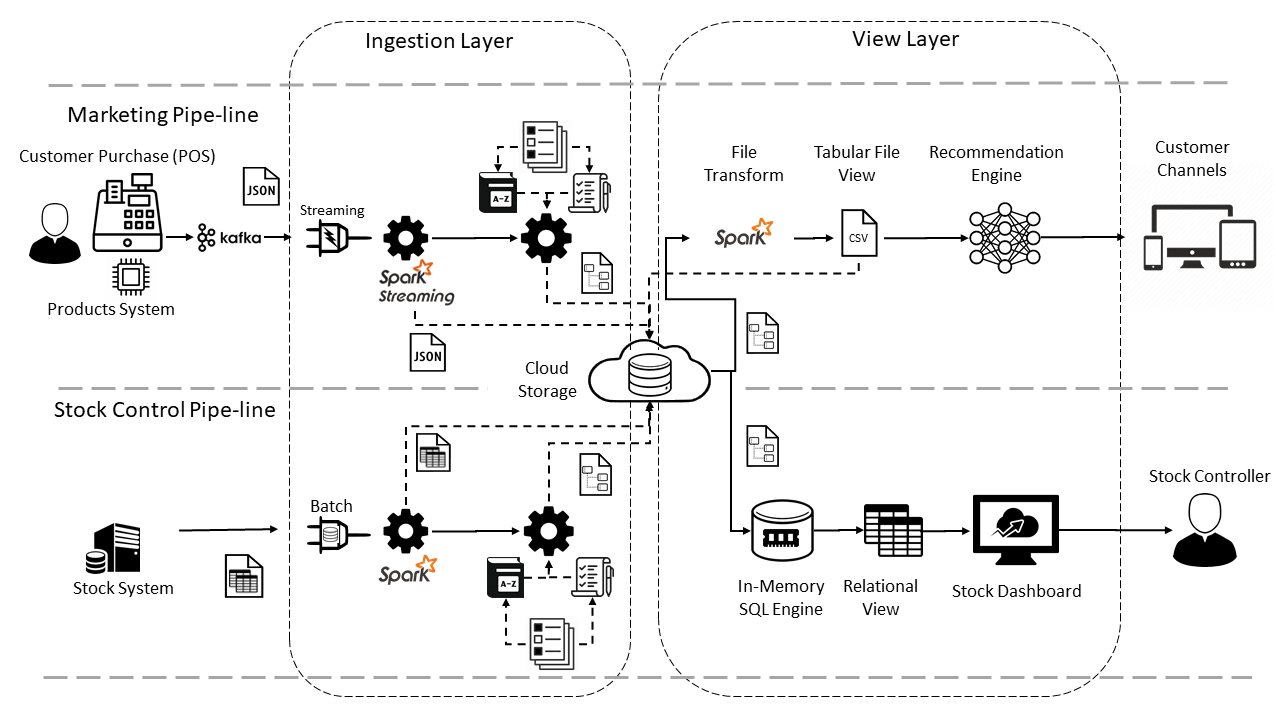
Here is an example of a retail challenge. Imagine there are two business lines, Marketing and Stock control who both want to use similar data but for different purposes.
As you can see there are two pipelines in the diagram. One for each use-case. They are separate but share components and data.
They both want access the data of items purchased at the point of sale. The marketing team want this to fire off-in real time offers and discounts so that the customer carries on shopping.
The stock control team wants the data so that they know what stock they need to purchase to minimise the amount of warehouse space required, thereby reducing storage and inventory cost.
But the way they want to use it and timeliness of access is different for both teams. The marketing team need to get the offer to the customer before they leave the shop, so time is critical. The stock team have a stock system that operates on a 2-hour window.
Let's delve into the ingestion flow.
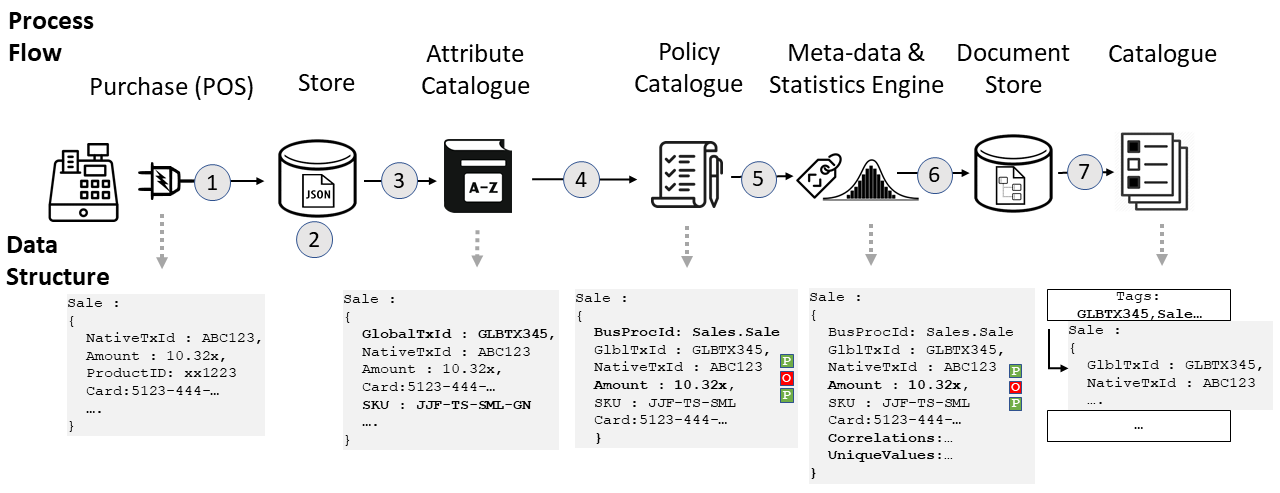
Step...
- Sales are received by the infrastructure via a messaging channel (e.g. Kafka, Kinesis etc.), the connectors receive and parse the object into memory
- The JSON object is stored on cloud storage in its raw form i.e. as a JSON file
- Each attribute is looked up in the data catalogue to see if its a global attribute. If it is then the other attribute is added that contains a global reference (if it has one)
- The policies are looked up and applied for the object, Data Quality etc. You can see the original attributes have assessed for data quality and the "amount" attribute has failed
- Meta-data (e.g. business process ID), statistics (e.g. unique values for columns and any correlations etc.) are added
- The document is indexed in the catalogues search engine and the object is stored in cloud storage as part of the globally accessible "Sale" collection in a queryable format (e.g. Parquet)
The next flow is the marketing use-case. This pipe-line is independent to the ingestion i.e. it's developed independently but is triggered by a new document appearing in the "Sale" collection.
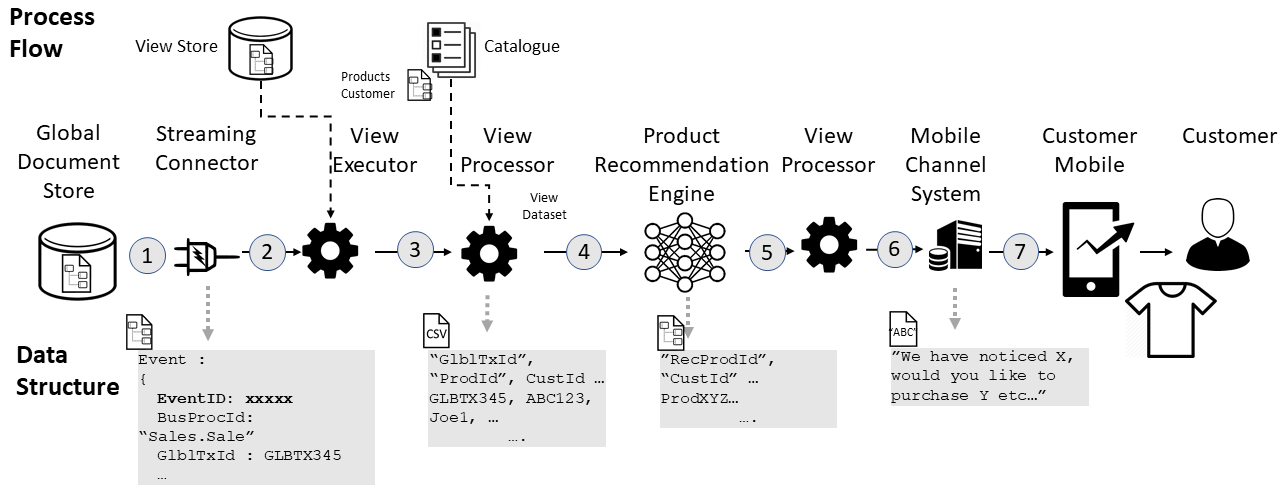
Step...
- A new document appears in the "Sale" collection.
- A view processor is created from a registration of that event.
- The view processor combines data from the new document with other collections (from the global repository) to create a wide table of features.
- The table is stored as a CSV file to be used by the machine learning model
- The recommendation engine picks up the CSV file, executes the model and outputs a list of recommended products
- The recommendations are sent to the channels application
- The recommendations are then he customers device
The next flow is Marketing use-case. This appears as an independent pipeline to the ingestion i.e. it's developed independently but is triggered by a new document appearing in the "Sale" collection.
Step…
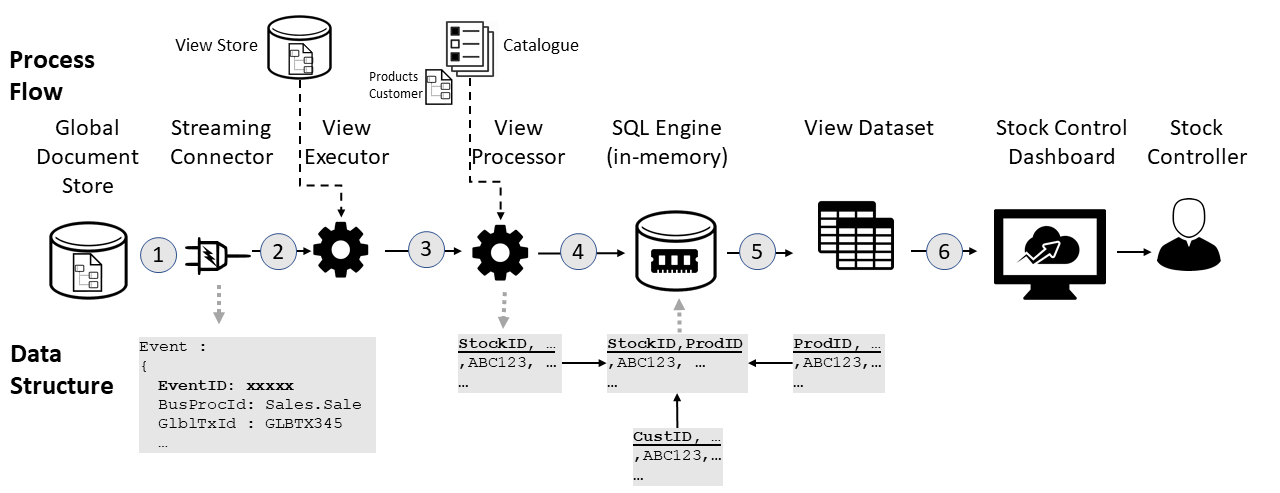
- A new document appearing in the "Sale" collection triggers the Stock control pipeline.
- A view processor is created from a registration of that event.
- The view processor spins up a SQL engine specialising in serving many concurrent SQL based queries from a relational schema
- The view processor combines data from the new document with other collections (from the global repository) to create tables as Parquet files for the SQL engine to present as a relational schema through OBDC/JDBC
- The SQL engine reads the Parquet files and creates an in-memory representation of them for many concurrent random-access queries
- The Business intelligence tool connects to the SQL engine and uses the schema to expose visualisations to the Stock Control team
Summary
This shows how two use-cases can co-exist on the same infrastructure, sharing the same source data but having their own pipeline and run-time profiles
And, hopefully I have shown how the Synchronised View Architecture solves the key challenges in building and running modern data infrastructures
The key takeaways are:
- It catalogues data assets to allow for quick discovery and massive reduction in data preparation
- It can run the tools disparate businesses use and can cope with many different processing patterns
- It runs on-demand cost-efficient scalable cloud infrastructure to massively maximise ROI whilst reducing time-to-market
Comments and feedback are really welcome and even if you want to know more, drop me a line by using the social media links, below