
Many people have asked me about the practical application of data products in real-world scenarios. To illustrate, I thought I'd showcase a complex yet effective use case: simplified trading and risk management flow. This example goes beyond simple use cases and tackles a more intricate business problem, demonstrating the versatility and power of data products.
Multi-Modal Processing Architecture
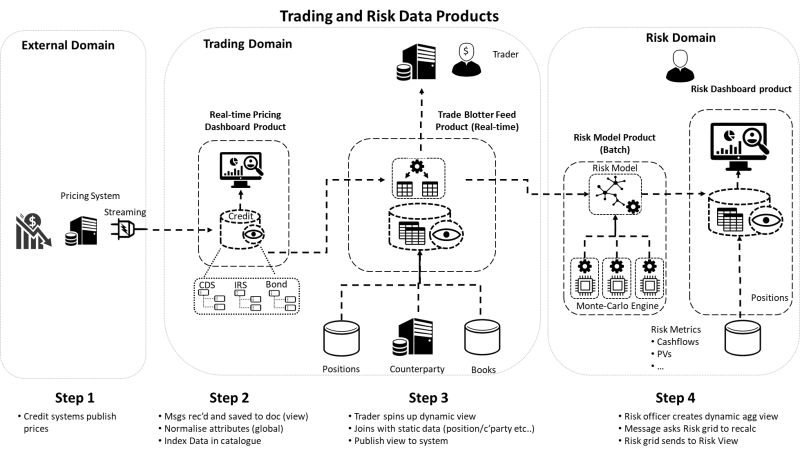
This use case features a multi-modal processing architecture, incorporating real-time pricing, micro-batch, and batch processing. Each data product in this flow is more than just data; it includes rules, complex algorithms, APIs, and dashboards.
Stage 0: Price Reception
The initial stage involves receiving prices for various investment products, such as Credit Default Swaps, Interest Rate Swaps, and Bonds, from different venues. These prices can arrive in real-time or as batch updates, requiring the business to react quickly. The connection technology may include a mix of proprietary and public APIs.
Stage 1: Real-Time Pricing Dashboard
The first actual data product is a real-time pricing dashboard displaying the current prices for each instrument. The underlying data structure is a document store, as pricing messages are often complex hierarchical documents. Some normalization is necessary to consolidate similar price structures from multiple venues. This product includes two interfaces: a query interface for the UI and an event interface for downstream consumption.
Stage 2: Trade Blotter
The next product is the trade blotter, where traders get their books/portfolios re-priced with each new price tick. This stack consists of a code-based execution engine with a fast column store and real-time events. Each open trade requires a specific pricing library to be executed for accurate pricing. It also joins real-time data such as open trades and reference data (e.g., counterparty, book).
Stage 3: Risk Calculation
This product calculates various risks (market, credit, etc.). The underlying stack includes a grid engine for performing complex chains of calculations, such as Monte-Carlo simulations using risk models wrapped as libraries. Additionally, a scenario engine allows risk officers to perform what-if analyses. For large, complex instrument books, these calculations may be executed in micro-batches, while simpler ones can be done in real-time.
Stage 4: Risk Dashboard
The results of the risk calculations are sent to a Risk Dashboard for risk officers to analyze and set bank limits, such as trading limits and downstream use cases like capital ratios. This involves a classic fast big data SQL engine with updatable tables and large historical tables for audit purposes (e.g., regulatory requests).
Conclusion
While this is a simplified flow, it effectively demonstrates the sophistication and power of data products when thought about comprehensively. Each stage and product is tailored to specific business needs, illustrating how data products can be more than just data—they are integral solutions combining various components to solve complex business problems.
This example highlights the importance of viewing data products not just as isolated datasets but as comprehensive tools that include the necessary algorithms, interfaces, and user applications to drive business value. If you're interested in exploring how to build and implement similar data products, feel free to reach out.