
Many organizations struggle to diagnose problems within their business effectively. Business teams often know something is wrong but get lost trying to penetrate the business process to understand exactly what is happening. This leads to a lot of frustration and time spent with data and analytics (D&A) teams, going back and forth sourcing, examining, and trying to comprehend the data.
That's why a different approach is needed—using the modern data ecosystem and data products to iteratively and quickly build a navigable map of the business to diagnose what is happening.
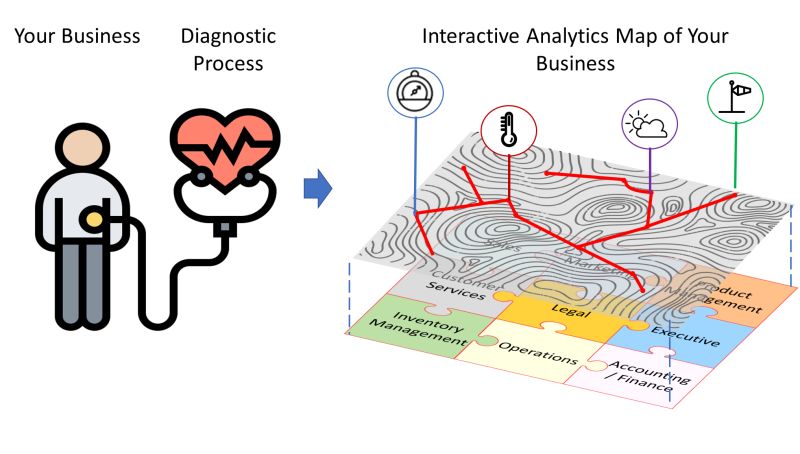
The Problem Diagnosis Approach
Much like a doctor examining symptoms and conducting successive tests to pinpoint the problem, the same method can be applied to business issues:
- Identify Symptoms: Start by looking at high-level metrics that indicate the problem. For instance, you may observe a month-over-month reduction in orders or an increase in last quarter costs.
- Create Initial Metrics: Develop data products (simple metrics) to measure these symptoms accurately. This data should be sourced directly from transactional systems or data warehouses, whichever is most appropriate. The key is to quickly and iteratively access the data without lengthy delays or multiple layers of intermediate communication.
- Analyze Contributing Factors: Once initial metrics are created, identify orthogonal data points that may contribute to the issue. Create data products to perform analyses such as correlations and cohort analyses to identify influencers. For example, if orders are down, examine cart abandonment rates from your e-commerce systems versus order fulfillment times.
- Build Production-Quality Data Products: Throughout this process, ensure that you are creating production-quality data products, not one-off analyses. These products should contribute to a living, breathing ecosystem. They should also be created by subject matter experts (SMEs) in the business, with minimal involvement from background teams.
- Visualize the Business Map: Each data product should contribute to a visual representation of the business, showing all processes, departments, and employees. This map will not only provide answers to current problems but also illustrate how everything is interconnected. Follow the 20/80 rule when designing the map: focus on the top business questions (or use cases) and present those on the map in a way that makes it convenient for business users to navigate, search, and locate the insights. This ensures the map remains a tool for clarity, not confusion.
The Benefits of a Business Map
With a comprehensive business map, diagnosing problems becomes much easier and quicker as more data products are added. The map allows for:
- Scalability: As the business grows and changes, the map can be updated with new data and strategies adjusted accordingly.
- Continuous Improvement: The map facilitates ongoing improvements and success by providing a clear, interconnected view of the entire business.
Key Requirements for Success
To achieve this approach, three critical aspects are necessary:
- A Data Diagnosis Process: Implement a process that allows for this type of diagnosis with business SMEs, such as our Data Product Pyramid.
- Data Infrastructure: Ensure that the infrastructure allows business SMEs to build out the business map using data mesh and data fabric concepts, complemented by data storytelling for visualization.
- A Data Product Operating Model: Establish an operating model that enables data products to be operationalized quickly.
Conclusion
This approach offers a path toward continuous improvement and success by providing a scalable, visual representation of your business. By using data products to build a navigable map, you can uncover valuable insights and address issues efficiently.
Call to Action
If you want to know how to use data products to build a navigable map of your business and discover what insights you can uncover, get in touch with us here at Dataception.